On this page
Weather month by month
Averages for 1991 to 2020 from the Ko Samui (WMO 48550) weather station, the nearest one to Koh Phangan in the source.
| Month | Avg high (°C) | Avg low (°C) | Rain (mm) | Rainy days | Sea (°C) |
|---|---|---|---|---|---|
| January | 29.0 | 24.2 | 126.8 | 11.1 | 28 |
| February | 29.4 | 24.9 | 64.3 | 5.6 | 28 |
| March | 30.4 | 25.4 | 115.8 | 5.9 | 29 |
| April | 31.8 | 26.0 | 82.9 | 8.1 | 30 |
| May | 32.9 | 25.7 | 131.6 | 14.0 | 30 |
| June | 32.7 | 25.3 | 133.6 | 13.1 | 30 |
| July | 32.3 | 25.1 | 117.0 | 14.3 | 29 |
| August | 32.4 | 25.1 | 102.2 | 14.5 | 29 |
| September | 31.9 | 24.8 | 117.5 | 15.0 | 29 |
| OctoberRainy season | 30.6 | 24.3 | 294.9 | 19.3 | 29 |
| NovemberRainy season | 29.7 | 24.1 | 444.6 | 18.7 | 28 |
| DecemberRainy season | 29.3 | 24.0 | 263.1 | 14.2 | 28 |
Sources: ubonmet.tmd.go.th (climate normals), weather2travel.com (sea temperature). As of .
In the Koh Samui station normals, which the table above uses for Koh Phangan, the wet peak runs from October to December, with November the wettest month. For 1991 to 2020, those three months bring 1,002.6 mm of the 1,994.3 mm annual total. July and August are not wet by comparison: 117.0 mm and 102.2 mm.
The table above shows the month-by-month figures. Koh Phangan has no station in our sources, so the table uses Koh Samui, the neighbouring island to the south: Wikipedia’s Ko Samui article lists Koh Phangan among the islands to its north. The figures in the text come from Wikipedia’s Ko Samui climate table (1991 to 2020, citing WMO normals) and from weather2travel’s Koh Samui averages, as read on 4 October 2026.
The Gulf of Thailand pattern
Koh Phangan sits in the Gulf of Thailand, where the rain follows a different calendar from the Andaman coast. Wikipedia’s Geography of Thailand says southern Thailand gets abundant rain in both monsoon seasons. The peak on the western coast is in September, and on the eastern coast it falls between November and January.
The Koh Samui numbers match that. Rainfall jumps from 117.5 mm in September to 294.9 mm in October, peaks at 444.6 mm in November, then eases to 263.1 mm in December. Weather2travel describes Koh Samui as having a hot tropical climate with a short dry season.
The driest months in the normals are February (64.3 mm) and April (82.9 mm). Sources draw the dry season differently. Wikivoyage’s Ko Pha-ngan guide names December to March as the best time, with clean water, little rain and pleasant temperatures. Its own climate chart for Koh Phangan, which does not state a station or period, shows the same shape: 306 mm in October, 423 mm in November and 166 mm in December.
Monthly totals also hide variation within a month. Wikivoyage says, in its Thong Nai Pan entry, that the November monsoon normally ends around the middle of December. The monthly normals cannot show how rain is split within December.
Why July and August stay usable
In its text, Wikipedia notes that Samui is relatively drier than Phuket: about 1,960 mm of rain a year against 2,220 mm. That rounded figure differs from the 1,994.3 mm annual total in the same page’s 1991 to 2020 normals table. Phuket’s wet season is spread over six to eight months. On the Samui figures, half of the annual total falls in October to December.
That leaves July and August with 117.0 mm and 102.2 mm. Both are below January (126.8 mm), and well below October. Daytime highs are 32.3 °C and 32.4 °C.
Weather2travel gives somewhat higher figures for the same months (146 mm and 137 mm), so the two sources agree on the pattern rather than the exact amounts. Both show these months as clearly drier than October to December.
Wikivoyage lists July and August as a second high season, following the dry season. Elsewhere in the same guide it calls them relatively low season. Availability and prices are therefore worth checking directly rather than assuming either.
Sea temperature and swimming
Weather2travel lists Koh Samui sea temperatures of 28 to 30 °C through the year. The sea is coolest, at 28 °C, in January, February, November and December. It is warmest, at 30 °C, from April to June, and at 29 °C in the other months.
On those figures, water temperature is not a reason to avoid any month. Swimming conditions depend more on the beach and the season than on warmth. Wikivoyage says Thong Nai Pan, which caters to families with children, has safe swimming all year except during the November monsoon. It lists Haad Rin as one of the few beaches where swimming is possible in the dry season. It also describes Bottle Beach as having good clean water for swimming even in the dry season.
Wikipedia reports that six of the seven box jellyfish deaths recorded in Thailand from 1999 to 2015 occurred on Koh Samui and Koh Phangan. The source does not break this down by month. Ask your villa manager or a local beach operator about current conditions before children swim.
Ferries and boat trips in wet weather
The sources give no cancellation statistics for ferries or speedboats, by month or otherwise. The only disruption-related figure is weather2travel’s share of each month affected by tropical storms for Koh Samui. It is 0 for January to September, 1.2% in October, 2.2% in November and under 1% in December.
That is a small share, but it falls in the months when rain is already heaviest. If your flight home is on a fixed date, build in a buffer day in those months. Check the operator’s notices closer to departure.
Separately, Wikivoyage advises booking ferry transport ahead if you travel near a Full Moon Party. The limited number of ferries fills quickly with the crowd. For a group of 6 to 16 people, that is worth acting on early in any month.
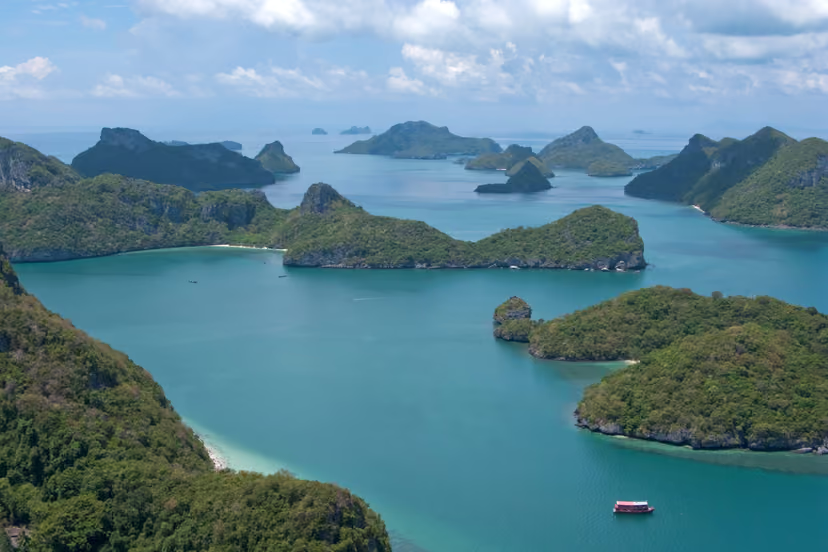
Day trips to Ang Thong are a different case. Wikivoyage says Ang Thong National Marine Park is 2 hours away by boat and is visited on a day trip through travel agencies. For those, choose the drier months where you can.
Month by month for a villa holiday
Weather in January
Rain is 126.8 mm, with a daytime high of 29.0 °C and sea at 28 °C. January is within the December to March window that Wikivoyage calls the best time for the island. It also falls in the peak season Wikivoyage places at December to February, when decent rooms run out. A larger group should book early.
Weather in February
February is the driest month in the normals at 64.3 mm, with a high of 29.4 °C. Weather2travel lists 39 mm and 9 hours of sunshine a day, the most of any month. It is the driest month in these sources, which makes it a good candidate for beach days and boat trips.
Weather in March
The normals show 115.8 mm and a high of 30.4 °C. Weather2travel gives only 54 mm for the same month, so the sources disagree here. Both place it well below the October to December peak. The sea reaches 29 °C.
Weather in April
Rain is 82.9 mm and the high is 31.8 °C, with sea at 30 °C. Weather2travel rates heat and humidity as very high from March to September. Plan outdoor activities for the morning and late afternoon, especially with young children. Wikivoyage lists the Songkran holiday in April among peak travel periods for train bookings.
Weather in May
The normals show 131.6 mm, and weather2travel gives 172 mm with 17 days of some rain. The high is 32.9 °C, the warmest month in the table. Beach days remain realistic, but the sources show more rain than in February.
Weather in June
The normals show 133.6 mm, with a high of 32.7 °C. Weather2travel gives 118 mm. The sea is 30 °C. This is a transitional month: warm water and moderate rain, with 0% of the month affected by tropical storms in the weather2travel figures.
Weather in July
Rain is 117.0 mm and the high is 32.3 °C, with sea at 29 °C. This is lower rainfall than January. Check availability and pricing, since Wikivoyage describes July both as high and as relatively low season.
Weather in August
August is 102.2 mm, the lowest rainfall from May to October. The high is 32.4 °C. Weather2travel records 0% of the month affected by tropical storms.
Weather in September
Rain is 117.5 mm and the high is 31.9 °C. For Thailand as a whole, Wikipedia describes August and September as the wettest period of the year. At Koh Samui, September is still on the drier side of the year. It is the last month before the step up in rainfall.
Weather in October
Rainfall jumps to 294.9 mm, about two and a half times September. Weather2travel puts 1.2% of the month under tropical storm influence. Outdoor days are possible, but a flexible plan serves a group better than a fixed boat-trip schedule.
Weather in November
November is the wettest month at 444.6 mm (weather2travel: 463 mm), with 2.2% of the month affected by tropical storms. Wikivoyage says Thong Nai Pan has safe swimming all year except during the November monsoon. Allow flexibility in beach and boat plans this month.
Weather in December
Rain is 263.1 mm in the normals and 188 mm at weather2travel, with under 1% tropical storm share. Wikivoyage says the monsoon normally ends around mid December and counts December within the best period for the island. The monthly figures cannot confirm how conditions change within the month.
How we checked
We compared the Koh Samui climate normals (1991 to 2020) with weather2travel’s long-term averages and with Wikivoyage’s guidance for Koh Phangan, all as read on 4 October 2026. Where the sources differ, both values are given. Ferry cancellation rates by month are not published in them.
Questions and answers
Which is the wettest month on Koh Phangan?
November. In the Koh Samui normals for 1991 to 2020, the station on the neighbouring island, November brings 444.6 mm of rain, against 294.9 mm in October and 263.1 mm in December (Wikipedia, citing WMO normals).
Is July or August a bad time to visit Koh Phangan?
Not on the numbers. Koh Samui normals show 117.0 mm in July and 102.2 mm in August, less than in January (126.8 mm). Wikivoyage lists July and August as a high season for the island, although it also calls them relatively low season elsewhere in the same guide.
How warm is the sea around Koh Phangan?
Weather2travel lists sea temperatures for Koh Samui of 28 to 30 °C through the year. The warmest months are April to June at 30 °C; January, February, November and December are 28 °C.
Can you swim on Koh Phangan in November?
It depends on the beach. Wikivoyage says Thong Nai Pan has safe swimming all year except during the November monsoon, which normally ends around the middle of December. Check conditions on the day.
When is the best time to visit Koh Phangan?
Wikivoyage names December to March as the best time, with clean water, little rain and pleasant temperatures, and says the November monsoon normally ends around the middle of December. July and August are the other option. Wikivoyage calls them a second high season, and the Koh Samui normals show 117.0 mm and 102.2 mm of rain in those months. October and November are the wettest months, with 294.9 mm and 444.6 mm.